Touch potentials are a result of the voltage drop over the earth between the earthing grid and the position of a persons feet, so if an earthing grid in a substation is placed deeper into the earth, the distance would be greater and therefore the voltage drop would become higher, right?
Not completely true. The touch voltage only tends to go up directly above the earthing electrodes. A bit further away, it actually goes down! In this post you will read why.
Laying depth of earthing grid
The earthing grid is normally laid at some depth below the earth’s surface. IEEE Std. 80 mentions a laying depth of 0.3 to 0.5 meter below grade, providing some example situations using 0.5 meter depth. IEC 50522 says that horizontal electrodes are preferably to be buried at a depth of up 0.5 to 1 meter, providing sufficient mechanical safety to the conductor. In addition it is recommended that the electrodes are situated below the frostline. Contrary to the IEEE standard, which says horizontal electrodes should be connected to vertical electrodes to cope with effects of frost.
Touch voltage
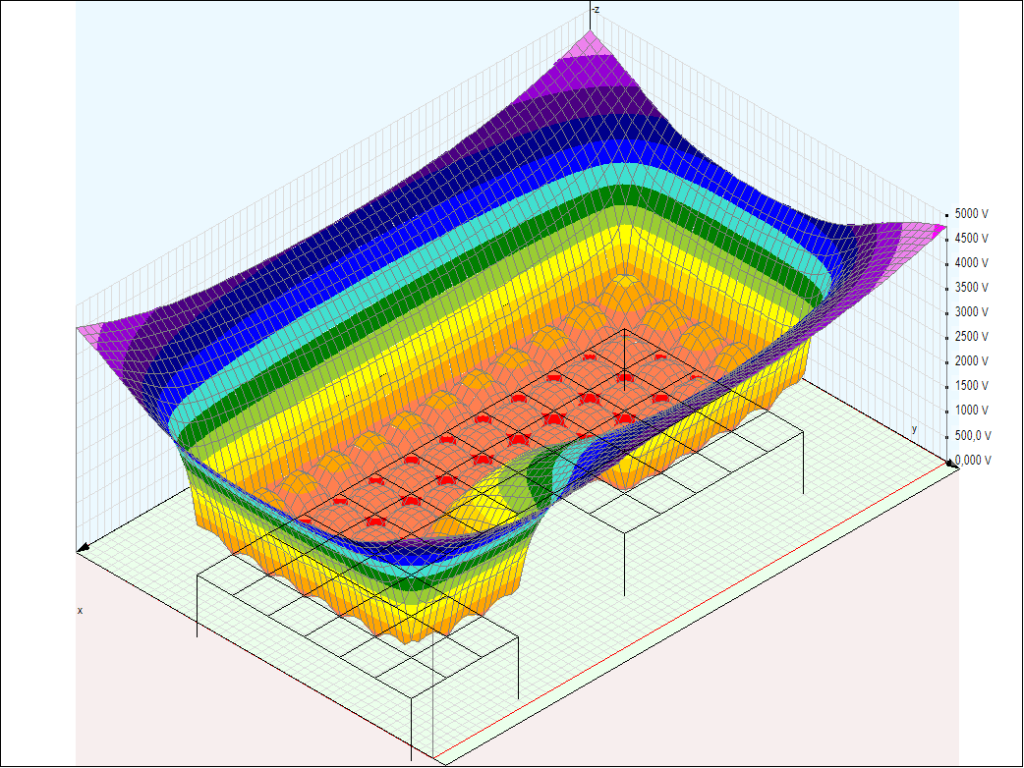
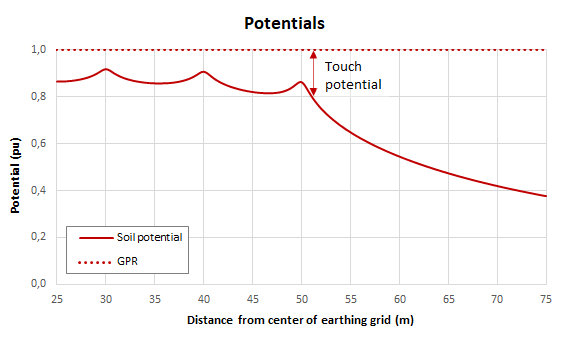
The touch voltage is the difference between the ground potential rise (GPR) of the earthed objects (including the earthing grid) and local soil potential, as presented in the figure below.
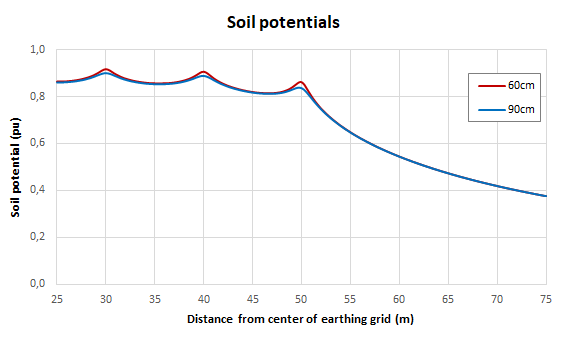
An increase of the depth will cause the soil potentials to go down, as can be seen in the figure below. This means that the touch voltages should go up, but this is only true when the GPR remains the same. And this is not the case. An increase of the depth of an earthing grid results in a decrease of the GPR. Remember that the GPR is determined by the current that flows into the ground, with ‘far earth’ as a reference. This means that the ‘parallel path’ for the current through earth is larger, resulting in a lower earthing resistance of the earthing grid.
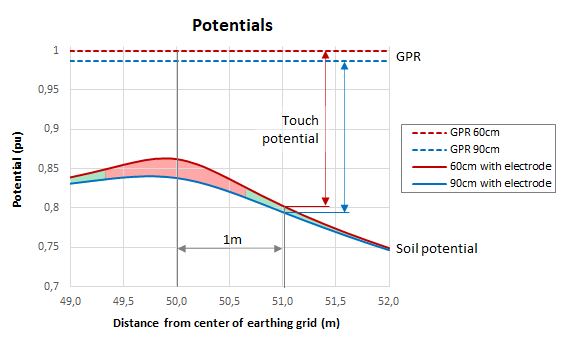
If the decrease of the GPR is greater than the decrease of the soil potential, then the touch voltage goes down. Nearby the horizontal electrode (located at X=50m in this example) this is not the case, so very locally the touch voltage will go up. A graphical representation of this effect is presented in the next figure. The touch voltage is indicated at X=51m for illustrative reasons, but of course depends on where above ground the touchable parts are. The red area is the part where the touch voltage becomes higher, and the green area shows where the touch voltage decreases.
Application range of this effect
This effect is valid for earthing grids that are in the typical ranges of depth, as mentioned above, up to 1 meter. The effect shown in the figures is based on calculations in software using a uniform soil model. For multi layer models where the lower layers have lower resistivity values the effect is even stronger. In case a multi layer model is used with the lower layer(s) of higher resistivity values, the presented effects will not be applicable. And finally it is also important to mention that we consider the short circuit current not to change due to the (slightly) lower earthing resistance.
Learn more about soil characteristics, soil potentials and touch voltages with this course.