Our preferred method to measure the tower footing resistance at a certain frequency is the oblique probe method. Never heard of this? You are not the only one. A pity, because the oblique probe method has many advantages, which you’ll find below.
Different methods available
There are multiple methods to measure the footing resistance of an overhead line tower. Often the Fall-Of-Potential (FOP) method is used. This method has the advantage that it can be applied if a limited amount of space is available, since both the voltage and current probe are placed along the same line (in the same direction). The Oblique probe method needs more space, since the probes go in a different direction, but it has some great advantages.
Oblique probe measurement method
In this method, similar to the FOP-method, a current is injected in the tower and a current return electrode is placed at a suitable distance from the tower (typically around 100m). The voltage probe however goes to the opposite direction as the current return electrode. This is done to make sure that only the potential of the tower is measured and the current return electrode does not influence the measurements.
Both leads shall be placed using a similar angle to the high voltage conductors, so that induced currents on the measurement leads are equal. The total parallel length shall preferably be as small as possible. Therefore an angle of 45 to 90 degrees to the overhead line conductors is advised. If possible, an angle between 60 to 90 degrees would be best.
The voltage probe shall be moved along the measurement line, for example from 20m to 100m from the tower, using interval steps of 10m. A reading is performed for every point, and the profile can be plotted in a graph.
Analysis of measurement
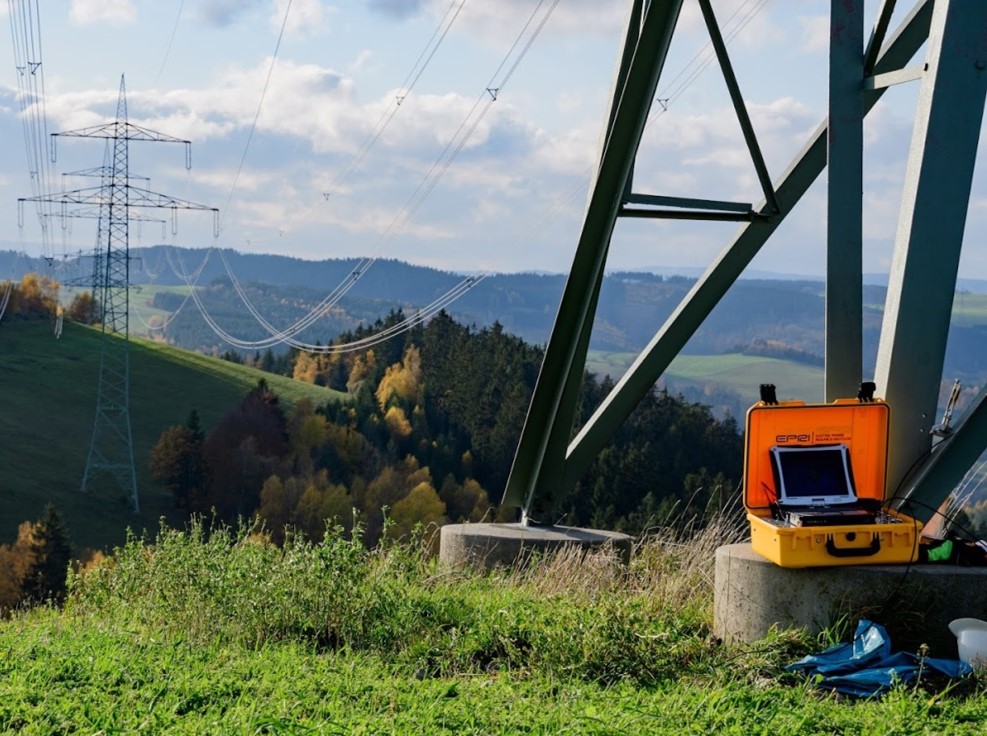
The graph displaying the measured values ideally looks like the figure below. It shows the measured values plotted directly against the distance of the electrode for voltage measurement.
The curve is approaching the value that we are looking for (it is asymptotic), which means that when the values are plotted against the reciprocal value of the distance (1/distance) this ideally results in a straight line.
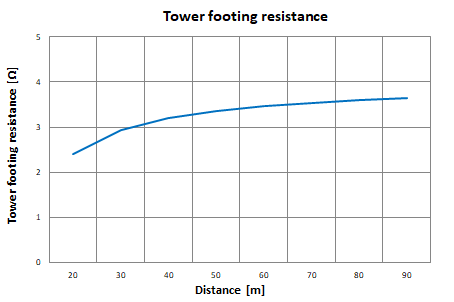
This graph provides two interesting parts of information:
- The line crossing at ‘0’ on the x-axis it represents ‘far distance’, this is the actual tower resistance for the given frequency. The value in this example results in 4 Ω.
- The steepness of the line indicates the applicable apparent soil resistivity around the tower. This value is determined by the multiplication of the steepness with -2π, in this example resulting in 200 Ω.m. Note: this value represents the soil around the tower in one value, although a more complex (multi-layer) soil structure can be present.
Actual measurements
Example with good reading
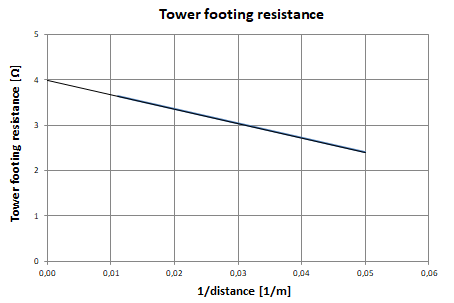
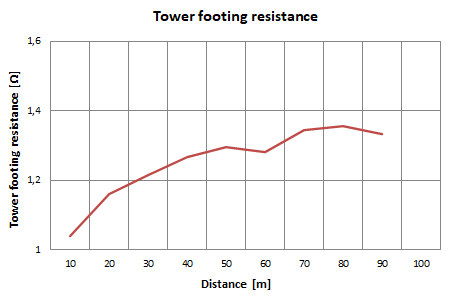
Some examples of actual measurements using the oblique probe method are given below. The first one shows a rather consistent measurement.

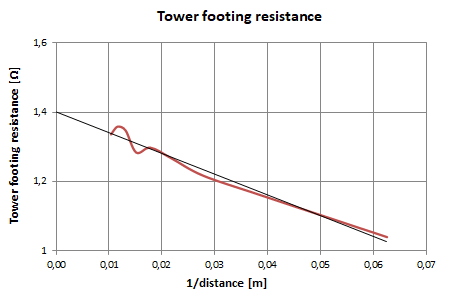
The analysis though, does not result in a perfect straight line. This indicates that the distance measurement was probably not quite accurate.
An iterative adjustment of the distance values finally results in a straight line, refer to the figure below. Note the slight change of the final value of the resistance, it goes from 35.3 Ω to 35.7 Ω. The estimation of the soil resistivity is approximately 400 Ω.m for the first attempt and goes up to around 650 Ω.m after adjustment of the distance. This is a significant difference!

Example with questionable reading
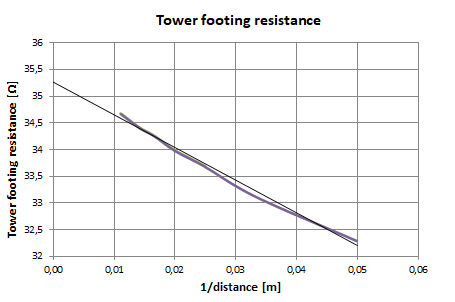
Another tower, with a totally different tower footing design and standing in a different soil type, shows the following readings, see the figure below. Especially the measurements at the distances of 60 and 90 meters seem to be inconsistent.
This is also visible in the analysis of the measurement, refer to the figure below. For cases like this it is advised to make an interpretation of the data that is available, in order to come up with a suitable end result. In this example the errors are limited, but it may happen that larger deviations are present. In that case it may be difficult to perform a proper assessment.
Application area
The oblique probe method can provide accurate results and insight in local soil conditions. Since a measurement profile with multiple measurement points is performed, you will also have an indication of the accuracy.
For active measurements (injecting a defined current) it is recommended to perform this type of measurement with disconnected shielding wires. For both active and passive measurements the connection of shielding wires can also be compensated by measuring the actual current(s) that flow into the soil. Note: please be aware of the fact that measurement devices that are delivered with compensation (Rogowski) coils may not be accurate for relatively low tower footing values (<10 Ω).
External influences may also disturb the measurements. They should be avoided by selecting a suitable direction and distance of the leads.
Do you want to become an expert on this topic? Then check out this course on measurements of tower footing impedances.